Configuring crosstab tables for advanced data customers
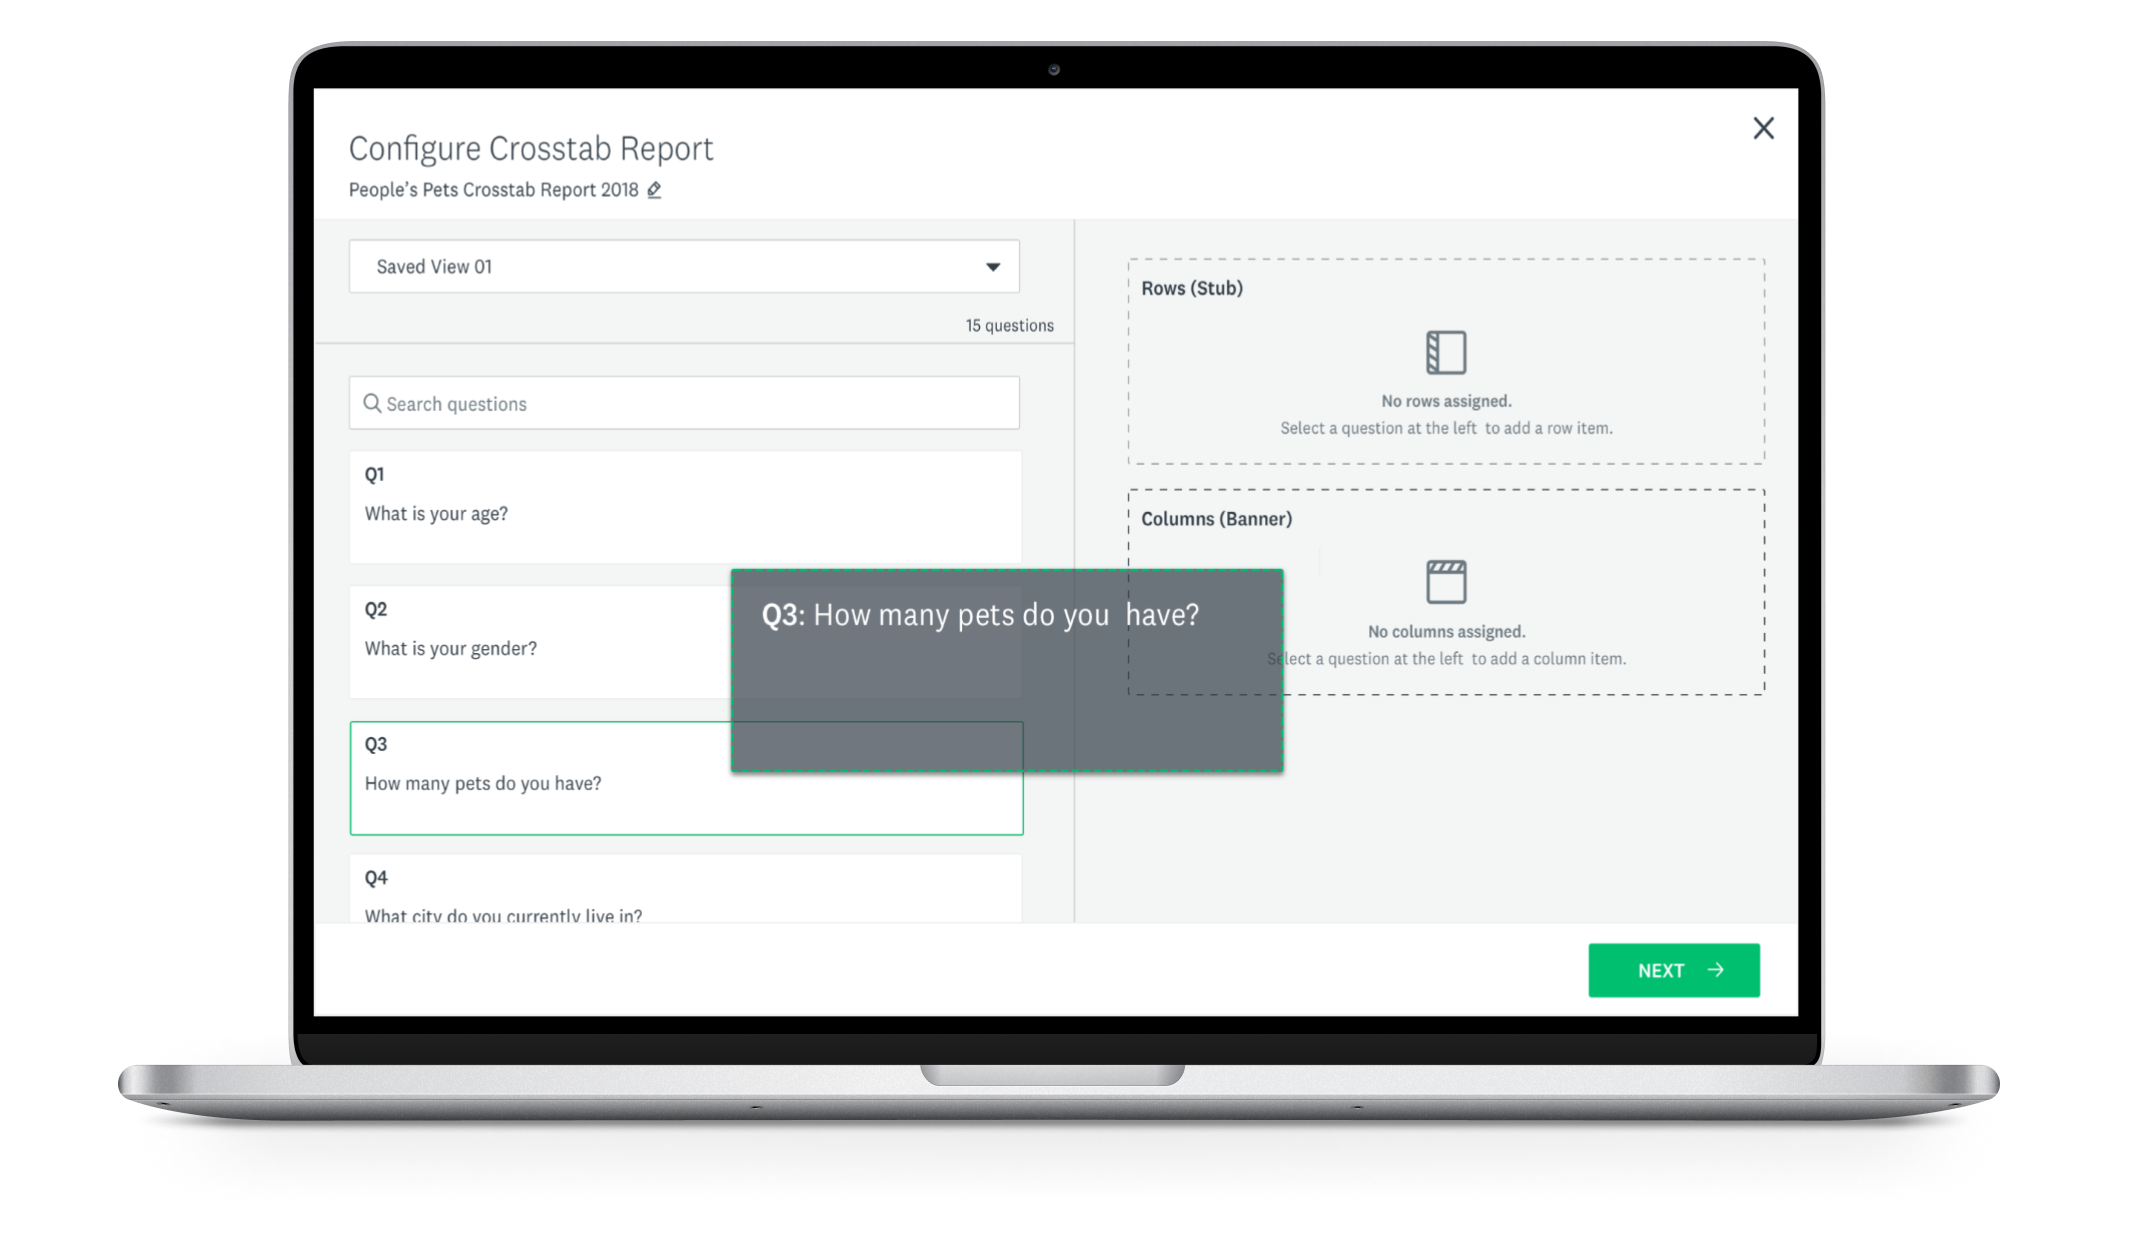
Configure your crosstab table
Role: Lead Product Designer for Analyze
Project: Crosstabs
Company: SurveyMonkey
Context
The compare function in Analyze was limiting as it allows only a two-question comparison with one rule active at a time.
In contrast, crosstabs looks for statistical significance or relationships between multiple variables such as age, gender, employment status, and the variables these may influence such as health, purchases, or travel for example.
Personas
By focusing on advanced users building crosstab tables outside our product, I could define the full end to end user journey.
This resulted in a niche persona, Peter, a Market Insights Manager, who works in market research and applies his intellectual and analytical skills to deliver insights to his clients and stakeholders.

Peter, an Insights Manager, a persona for crosstabs
User Journey
Peter’s needs and goals were summarized into these themes of model, tasks and modes.
Agency model: Conducts projects end to end, exports the report, and packages and shares it with stakeholders
Templated task: Peter already does this in Excel with a pre-formatted template and has a pretty good idea up front how to assign data to the banners (columns) and stubs (rows)
Presentation mode: Once Peter is done exploring, he’ll move into presentation mode ie he’ll prepare the crosstab report to share with others

User journey from access in Analyze through the crosstab builder and into the reporting flow
User Testing & Interaction Design
The experience of building and configuring a crosstab table was my main focus along with scaling the reporting and publishing flow. I had just designed for our new Results Dashboards UX. Now it was just a matter of accommodating this as the next report type.
Key areas of design included:
Access points to discover crosstabs
Adding question data to a row or column
Editing the question-answer options
Re-ordering row and column elements
Swapping rows and columns
Viewing statistical significance within the table
Creating a crosstab report, publishing and sharing it with collaborators
Managing (editing, viewing, deleting, etc.) your crosstabs
I took these key design areas along with my assumptions into a round of user testing in order to gather feedback and evidence to inform subsequent and final designs using an iterative approach.

Add questions to our rows or columns
Re-order or swap your row or column items
Customize your crosstab table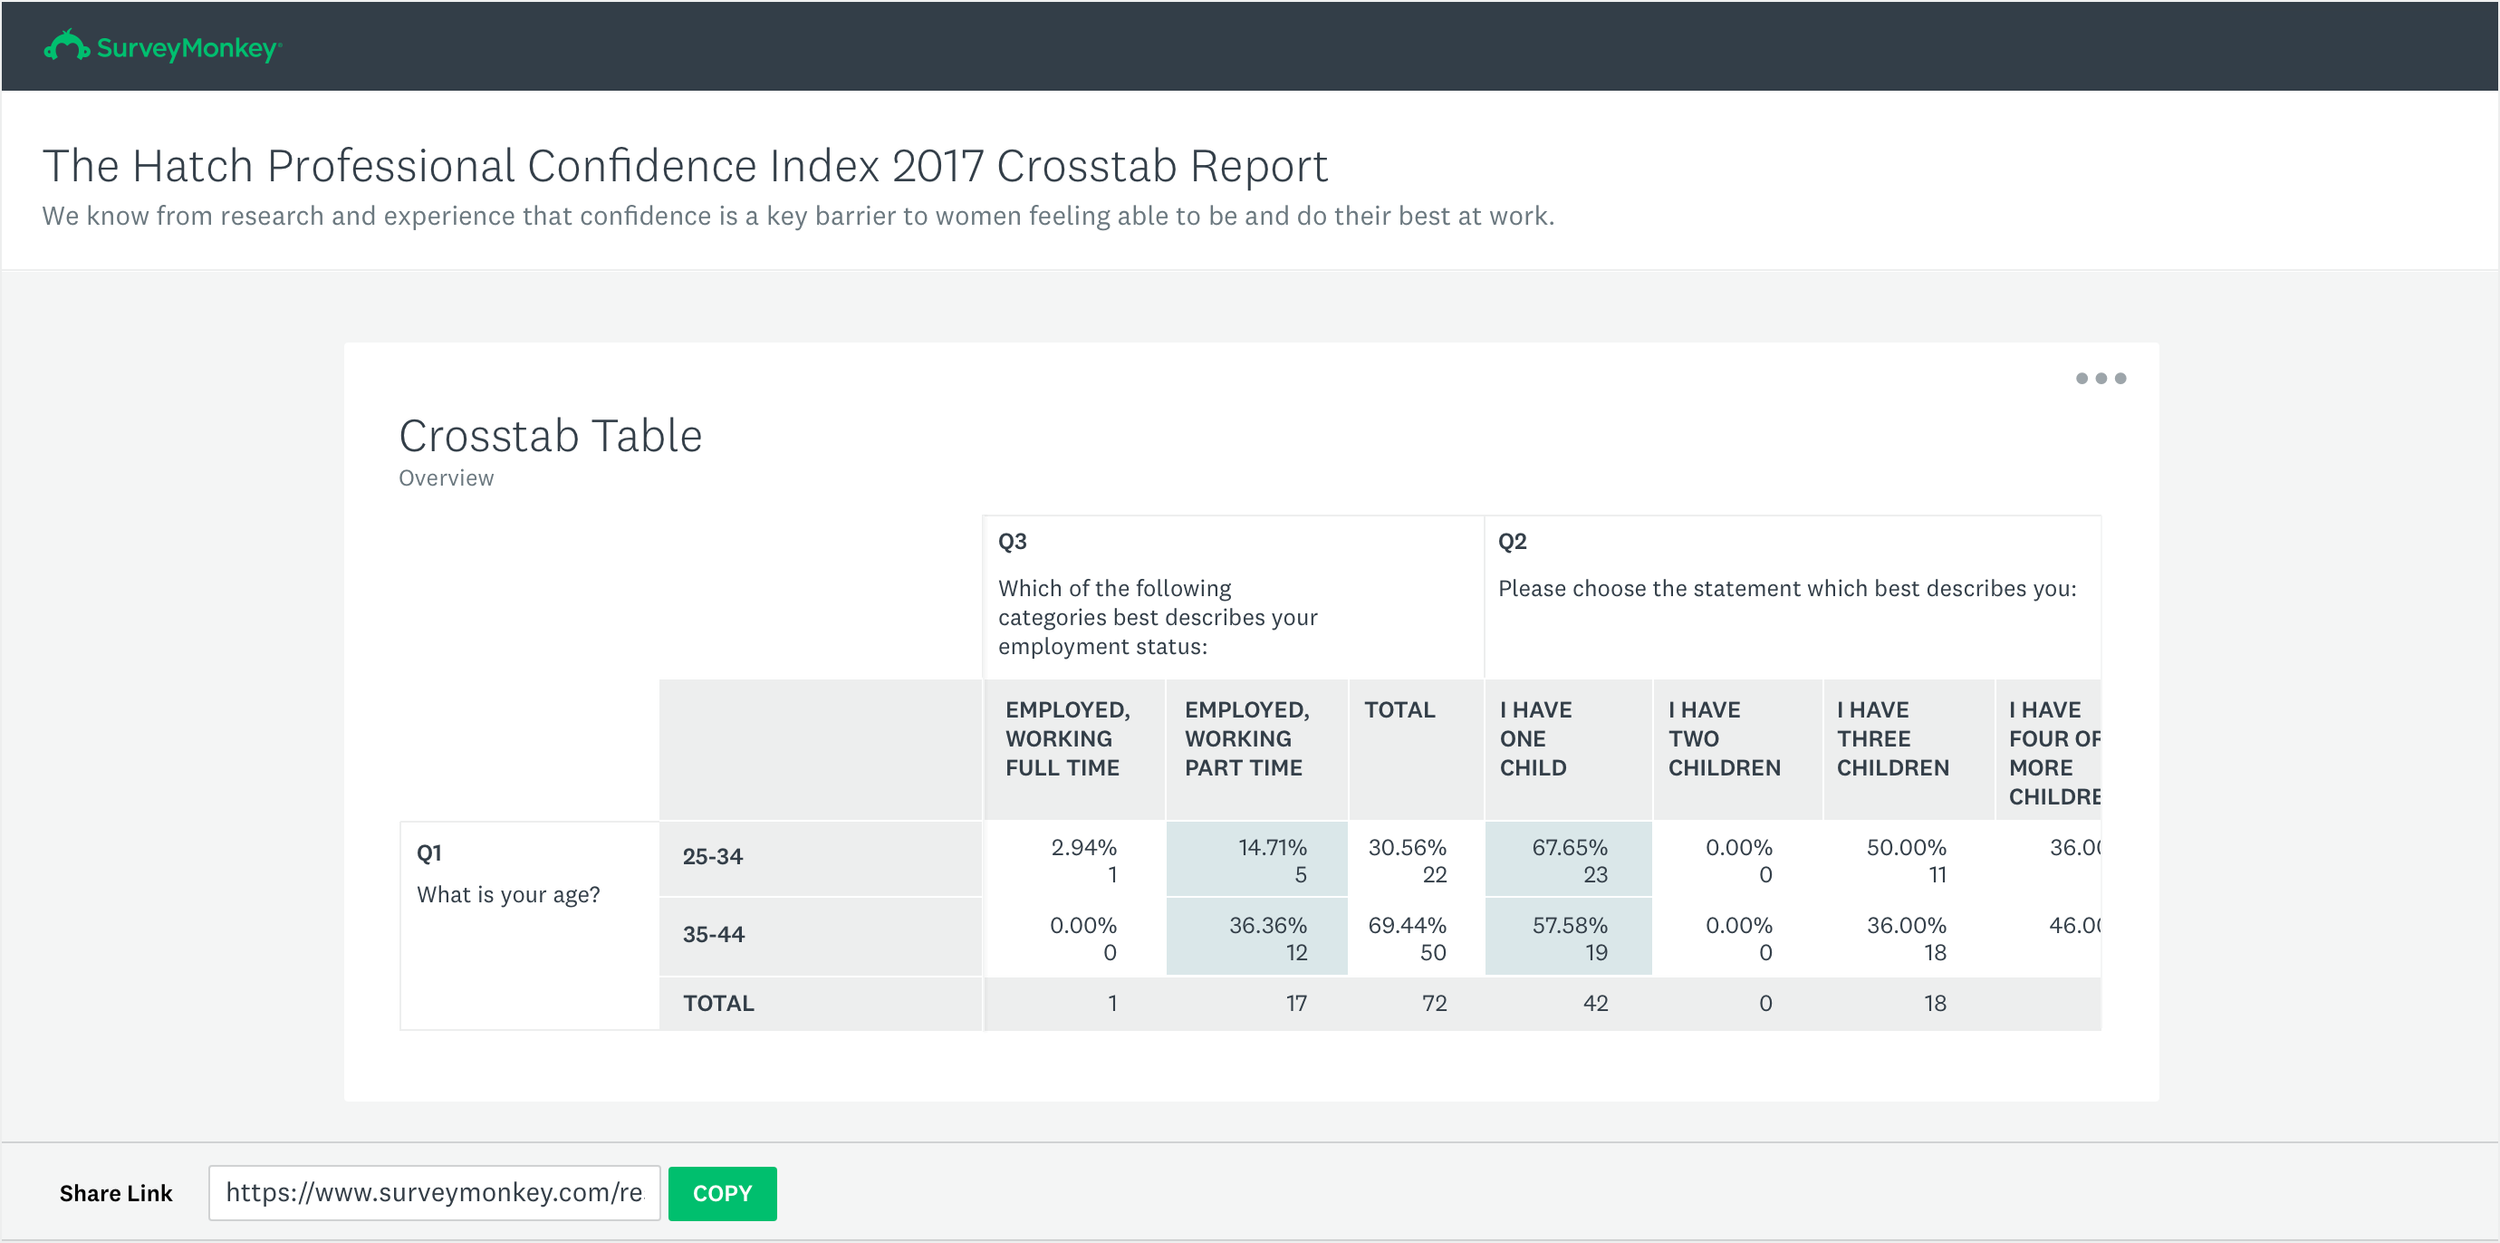
Shared your reports via a web link
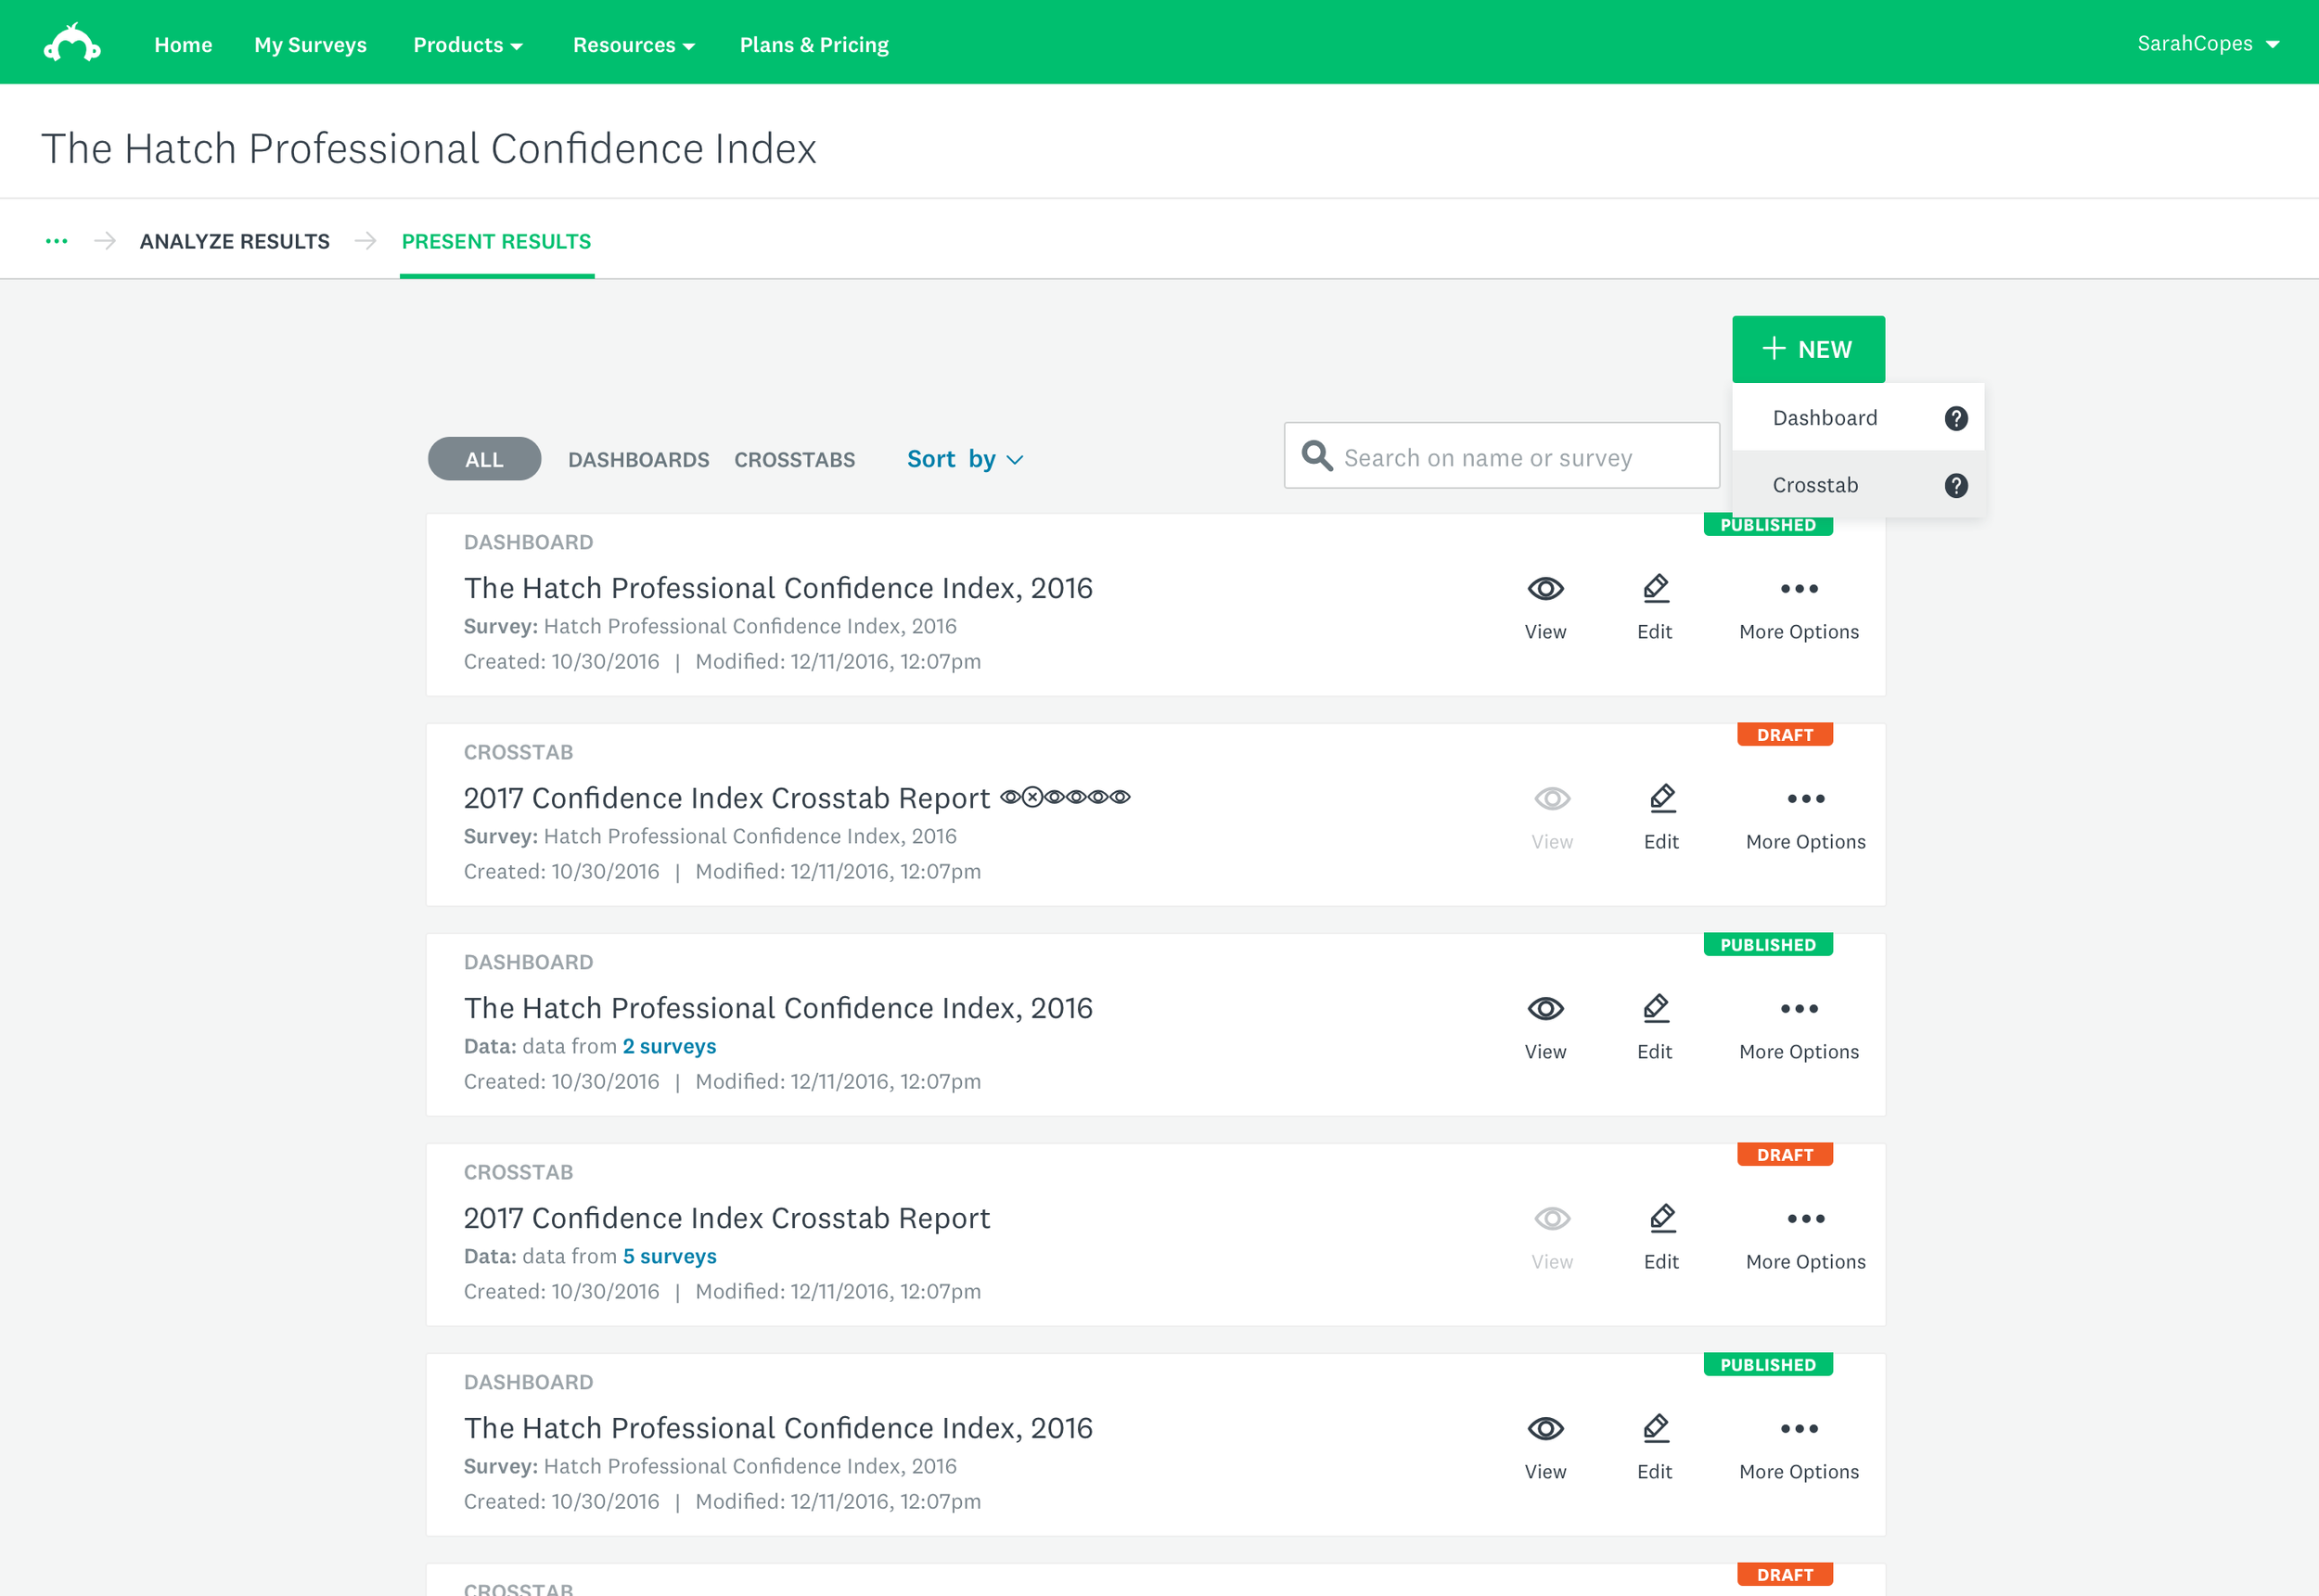
Manage your list of crosstab reports
Browse reports on your mobile deviceOutcome & Impact
Crosstabs was monetized as a premiere enterprise feature.
The advanced analysis feature increased our retention and market share by achieving feature parity with competitors. And by scaling crosstabs into the new reporting experience, we enhanced virality through cross-sell moments which aligned well with SurveyMonkey’s freemium business model.